BLOG
KO
Building a Shared FE Logger for the Team
- 1. Choosing a Library
- 2. Designing Log Messages
- 3. Implementation
- Adding User Identification Information
- 4. Serverless Architecture Implementation and Packaging
- 5. Results
While developing multiple services, I've always had one goal I wanted to achieve:
"We should be the first to know about our service's problems"
I've tried external tools like Sentry and Datadog, but due to costs and various overheads, we've been monitoring using AWS CloudWatch and Slack. However, this approach had the following problems:
Problem 1) No Standards
- There's no standard for what logs get sent to CloudWatch
- Nobody knows what logs are being captured, why, or how
Problem 2) Multiline Issues
- With the ECS task's awslogs driver sending stdout/stderr directly to CloudWatch, logs with line breaks get split into multiple events
- A single log gets fragmented by the number of line breaks, reducing readability and making filtering/searching impossible
With the goal of "having all services collect logs through a single logger," I started this project, and I'd like to share the thoughts and considerations from that process.
TL;DR Design structured log messages and implement a shared logger that all services can use with minimal overhead.
1. Choosing a Library
Before diving into the implementation, I chose a logging library. I wanted to build a logger that works both in the browser and server-side, so I compared four libraries commonly mentioned in the JS ecosystem.
| Candidate | Pros | Cons |
|---|---|---|
| consola | Pretty log messages Excellent DX |
Weak at structured logging Awkward for production log pipelines |
| pino | Very fast Single-line JSON output by default Official browser option support |
Some options have a learning curve |
| winston | Easy to save to file, DB, etc. via transports Output format definable via format combine |
Not browser-friendly Slow |
| loglevel | Very lightweight and simple Good as a console wrapper |
Weak at structured logging Lacks transport/context features |
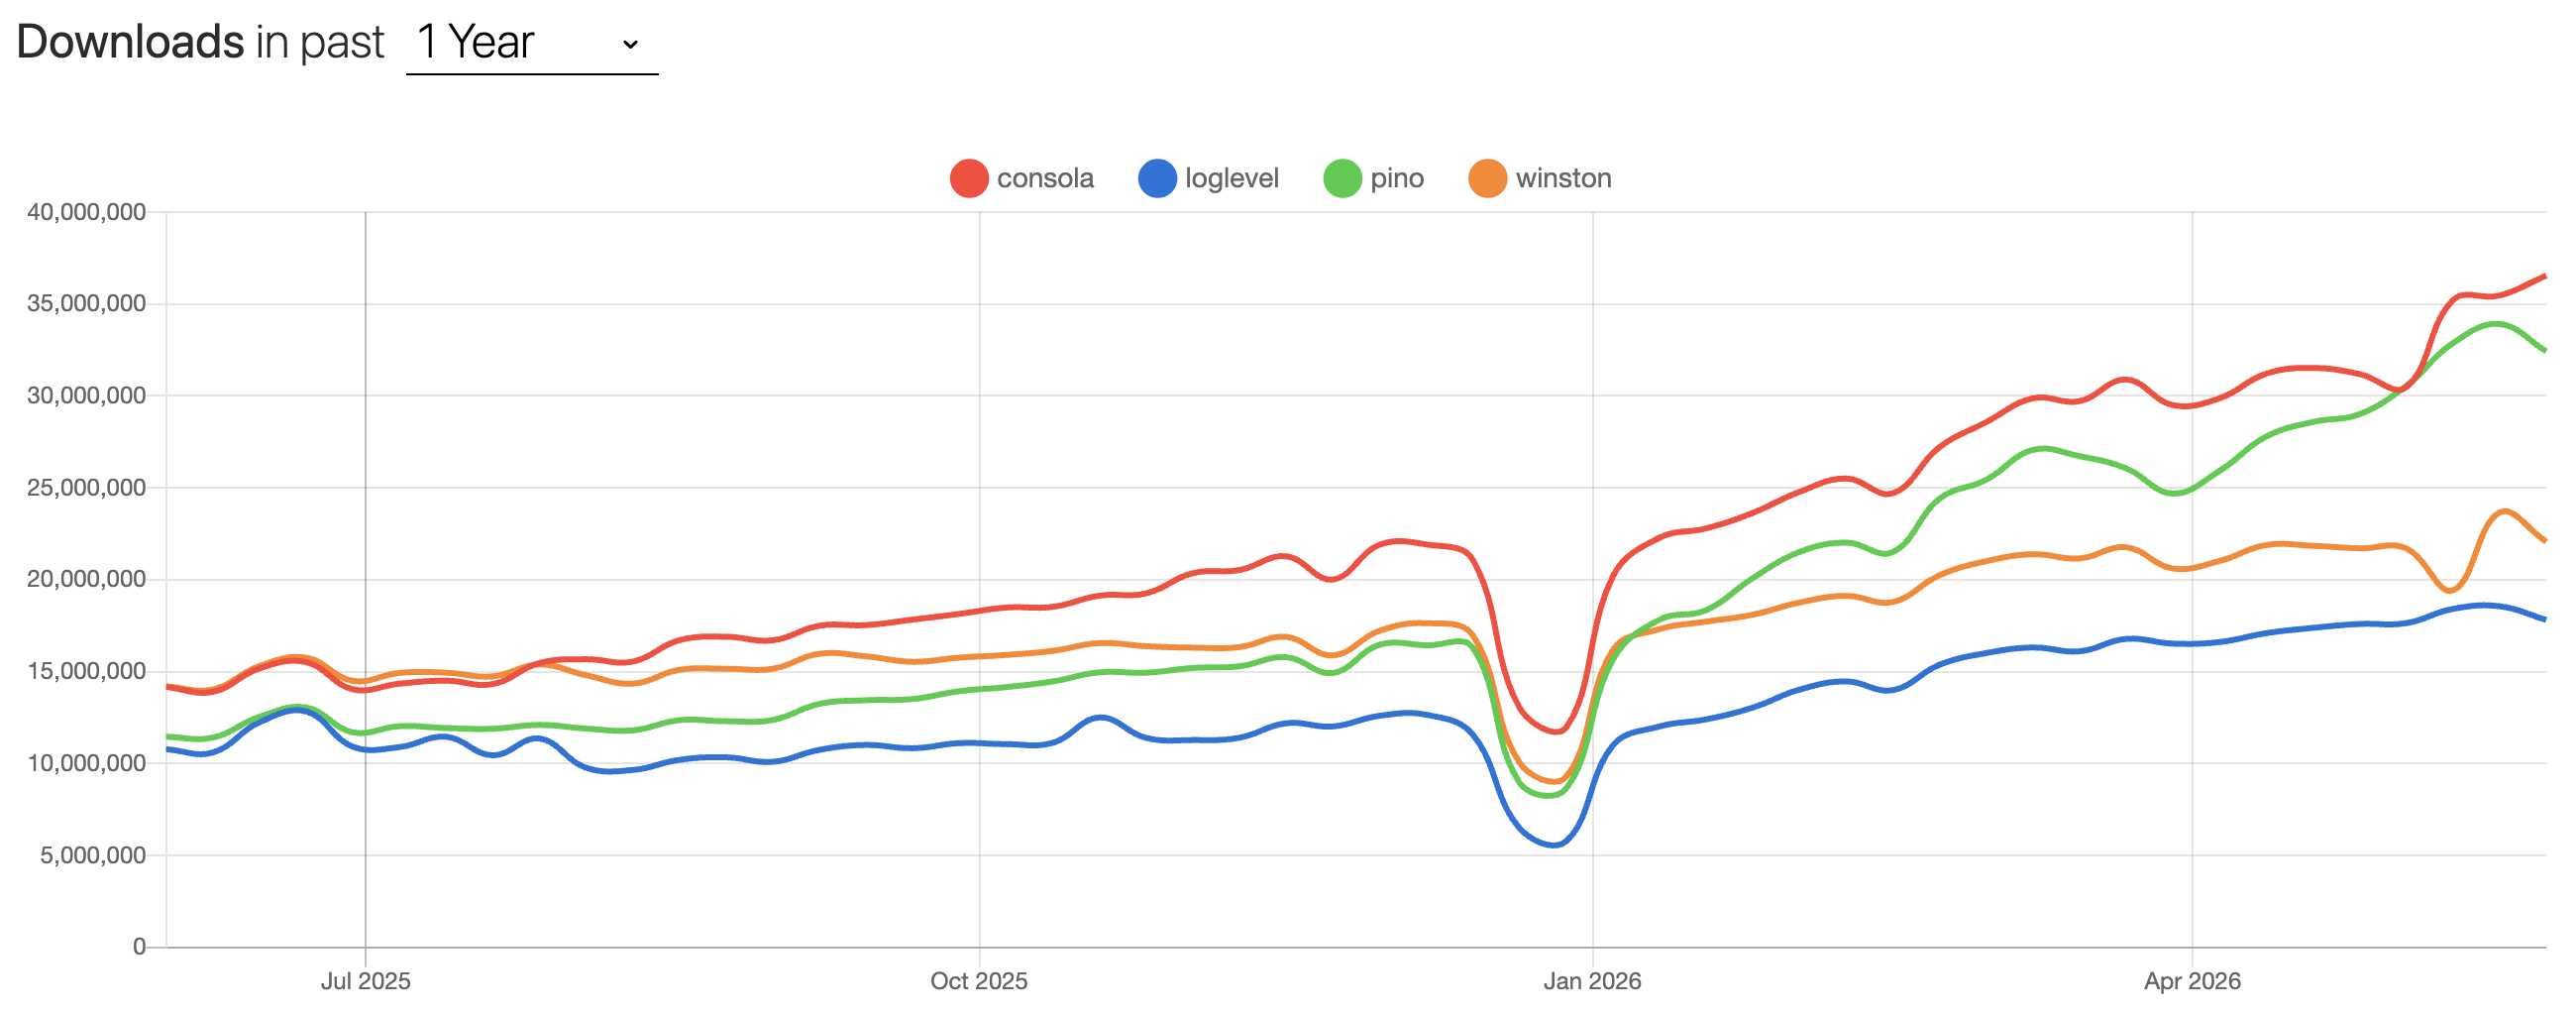
While consola leads in npm trends, I chose pino because it outputs JSON by default, is Node.js-based, and provides browser options.
2. Designing Log Messages
Now that I've chosen a logging tool, it's time to design the log message structure I want to see!
Initially, I considered a breadcrumb-like structure that would include where (Where) the user was and what action (What) they took in a hierarchical relationship.
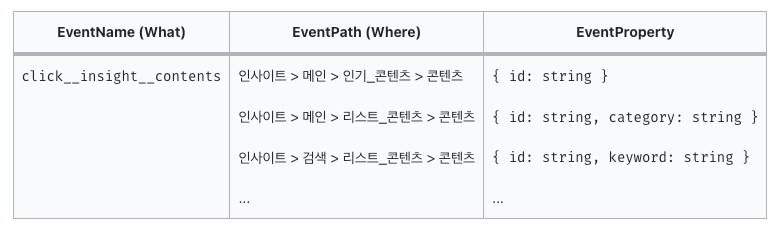
This would be valid if the goal was to understand user behavior data and funnels, but for viewing specific situations like errors (my initial goal), it felt unnecessarily complex. So I ultimately implemented a structure where you just declare "log name (and log message if needed)."
Below are the properties included in actual log messages and their descriptions:
| Key | Description | Example |
|---|---|---|
| logName | Log name | axios.response.error |
| logMessage | Message to include in the log | failed to fetch profile for user |
| username | Inpock username | hakjae |
| logLevel | Log level (only error in production) |
error / info |
| logService | Service name | business |
| logEnvironment | NODE_ENV from environment variables | production |
| logStage | Deployment environment | production |
| runtime | Service runtime | node / browser |
| version | Service version | 2.14.1 |
| logPath | Path where log occurred | /admin/deal/chat |
| logSource | For identifying browser logs | browser |
| error | Auto-serialized Error instance | { type, message, stack, status, url, method, data } |
Among the properties above, I designed the structure so that all values except logName, logMessage, and username would be determined by the logger itself, not the service calling the logger, and then proceeded with implementation.
3. Implementation
Let me walk you through the logger code implemented in the initial stage along with the key options.
// packages/logger/src/index.ts
const baseOptions: LoggerOptions = {
  level: process.env.LOG_LEVEL ?? defaultLevel,
  messageKey: '__noop_msg__',
  errorKey: '__noop_err__',
  base: {
    logService: process.env.LOG_SERVICE,
    logEnvironment: process.env.NODE_ENV,
    logStage: process.env.STAGE,
    version: process.env.APP_VERSION,
    runtime: typeof window === 'undefined' ? 'node' : 'browser',
  },
  redact: { paths: REDACT_PATHS, censor: '***REDACTED***' },
  formatters: { level: (label) => ({ logLevel: label }) },
  timestamp: false,
  browser: {
    asObject: true,
    transmit: {
      level: 'debug',
      send: (level, logEvent) => {
        if (process.env.STAGE === 'production') return;
        const messages = logEvent.messages ?? [];
        const ctxObj = (messages.find((m) => typeof m === 'object' && m !== null) ?? {}) as Record<
          string,
          unknown
        >;
        const bindings = (logEvent.bindings ?? []).reduce<Record<string, unknown>>(
          (acc, b) => ({ ...acc, ...b }),
          {},
        );
        const payload = JSON.stringify({
          level,
          ctx: { ...bindings, ...ctxObj },
        });
        try {
          const blob = new Blob([payload], { type: 'application/json' });
          if (navigator.sendBeacon?.('/api/log', blob)) return;
        } catch {
          // sendBeacon fail → fetch fallback
        }
        fetch('/api/log', {
          method: 'POST',
          headers: { 'Content-Type': 'application/json' },
          body: payload,
          keepalive: true,
        }).catch(() => {
          // 검증 도구가 사용자 화면에 에러 띄우면 안 됨
        });
      },
    },
  },
};- redact (official docs)
- Redact means to censor or remove confidential, private, or sensitive information from documents or data, also referring to masking. As the definition suggests, this option is used when you need to mask sensitive information (e.g., tokens, secrets) that shouldn't appear in logs.
- browser (official docs)
- The browser option specifies how pino should behave in the browser. Pino can be used in browsers through compatibility with
browserify, a bundling tool that transforms Node.js-style code to run in browsers. - Since I implemented the logger in a Next.js-based service, I implemented it to generate logs through the API router. Using the
sendBeaconAPI within the transmit option, I made it send logs to the/api/logpath, and implemented the/api/logroute in each service.
- The browser option specifies how pino should behave in the browser. Pino can be used in browsers through compatibility with
Adding User Identification Information
Also, since we need to quickly identify the user who generated the log and immediately move to CS or bug resolution, I implemented it to add user identification information beyond the already-masked sensitive data.
Instead of the inefficient approach of adding user identification information every time a log is generated, I implemented it so that the user identifier username is added to the logger just once in _app.tsx. I thought I could just add username to the properties, but the following problems existed:
For Browser
- Separate JS process per user
- Just need to add username to properties during hydration
// packages/logger/src/index.ts
let properties: Record<string, unknown> = {};

export function setLogProperty(bindings: Record<string, unknown>): void {
  if (typeof window === 'undefined') return;
  properties = { ...properties, ...bindings };
}

// 서비스 내 _app.tsx의 hydration 코드 내에서
useEffect(() => {
  setLogProperty({ username: user?.username });
}, [user]);
But for Server
- ECS Fargate running the service is Node.js-based
- In other words, the logger called on the server runs on Node
- Node.js modules are loaded only once per process, and all requests share that process
- If you simply add to properties like in the browser, usernames could get mixed up between logs
Therefore, on the server side, we need to add user identification information to the logger and maintain it throughout asynchronous operations.
Node.js has an AsyncLocalStorage API that makes this possible. (official docs)
According to the description:
"This class creates stores that stay coherent through asynchronous operations."
Using this, I imported the AsyncLocalStorage class within the logger to create an instance, passed the necessary log properties, and made the logger execute.
// packages/logger/src/index.ts
let asyncLocalStorage: AsyncLocalStorageLike | null = null;

if (typeof window === 'undefined') {
  try {
    // eslint-disable-next-line @typescript-eslint/no-implied-eval
    const nodeRequire = eval('require') as NodeRequire;
    const { AsyncLocalStorage } = nodeRequire('node:async_hooks') as {
      AsyncLocalStorage: new () => AsyncLocalStorageLike;
    };
    asyncLocalStorage = new AsyncLocalStorage();
  } catch {
    // edge runtime 등 async_hooks 미지원 환경
    asyncLocalStorage = null;
  }
}

export function runWithLogContext<T>(bindings: Record<string, unknown>, fn: () => T): T {
  if (!asyncLocalStorage) return fn();
  return asyncLocalStorage.run({ ...bindings }, fn);
}

// 서비스 내 _app.tsx
MyApp.getInitialProps = async (appContext: AppContext) => {
  ...
  return runWithLogContext(
    // 필요한 property와 함수를 넘겨 로거가 실행되게 함
  )
}
Yay! Now we have a structure where you can generate logs in the desired format anywhere just by installing the logger package and declaring the /api/log path.
But...
The API router approach was too framework-dependent, and having each service receive requests was not stable. Also, the fact that developers integrating the logger had to declare the /api/log path every time meant it didn't satisfy the initial goal of "a logger usable with minimal overhead."
To solve this, I designed an architecture that evolved one step further.
4. Serverless Architecture Implementation and Packaging
I defined the architecture requirements as follows:
-
Implement as serverless, not an always-running server
-
Must have an endpoint to receive log events
-
Create an architecture managed by code, not manually in the AWS console
-
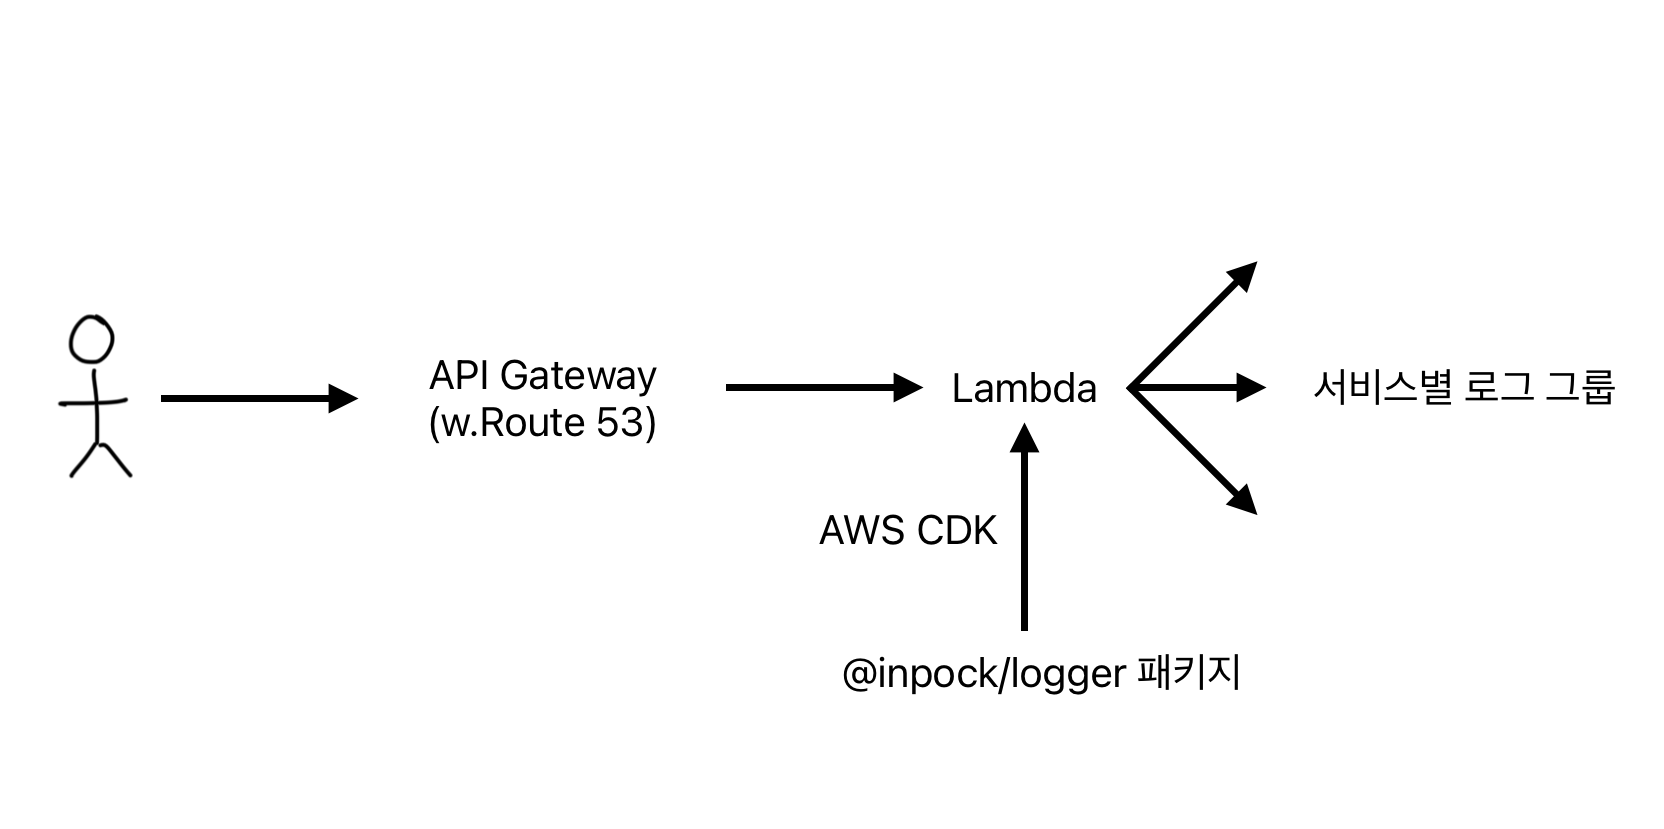
Deploy the logger to Lambda to implement a serverless environment
-
Create endpoints using API Gateway and Route53
-
Manage and deploy all of this using AWS CDK from the terminal, not manually from the console
Additionally, I deployed the logger as an internal package so that each service can just install it and call it as shown below, and logs will accumulate in the CloudWatch Log group designated for each service.
// services/A/env.production
NEXT_PUBLIC_LOG_ENDPOINT="로그_엔드포인트"

// service/A/src/pages/_app.tsx
import { configureLogger } from '@inpock/logger';

configureLogger({ endpoint: `${process.env.NEXT_PUBLIC_LOG_ENDPOINT}?service=A` });

// services/A/src/특정_페이지.tsx
import { logger } from '@inpock/logger';

logger.error('특정_에러_메시지', { error });
5. Results
Now let's check out the results of the completed logger.
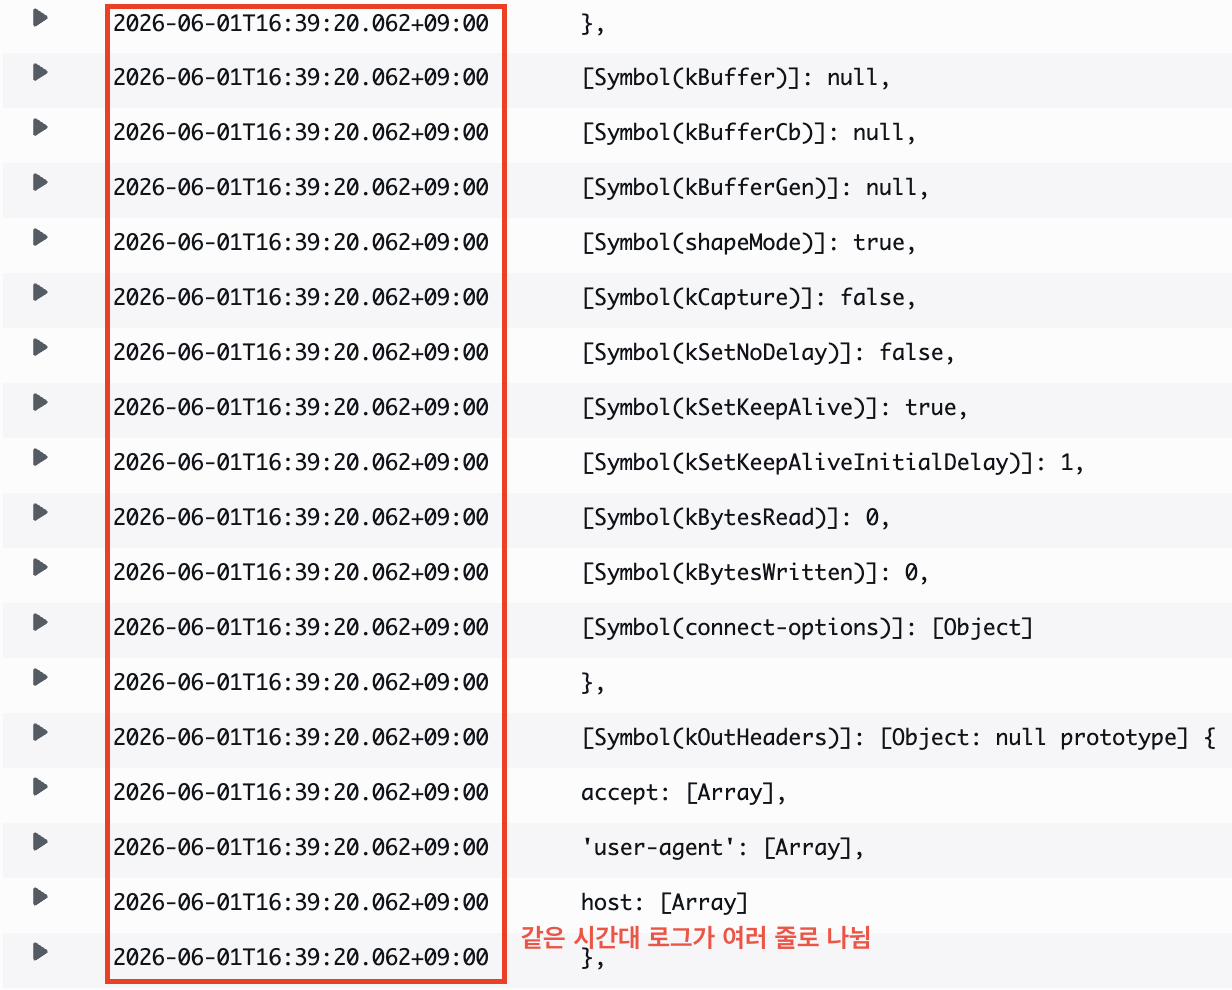 Before building the logger, logs from the same time period were piling up indiscriminately like above.
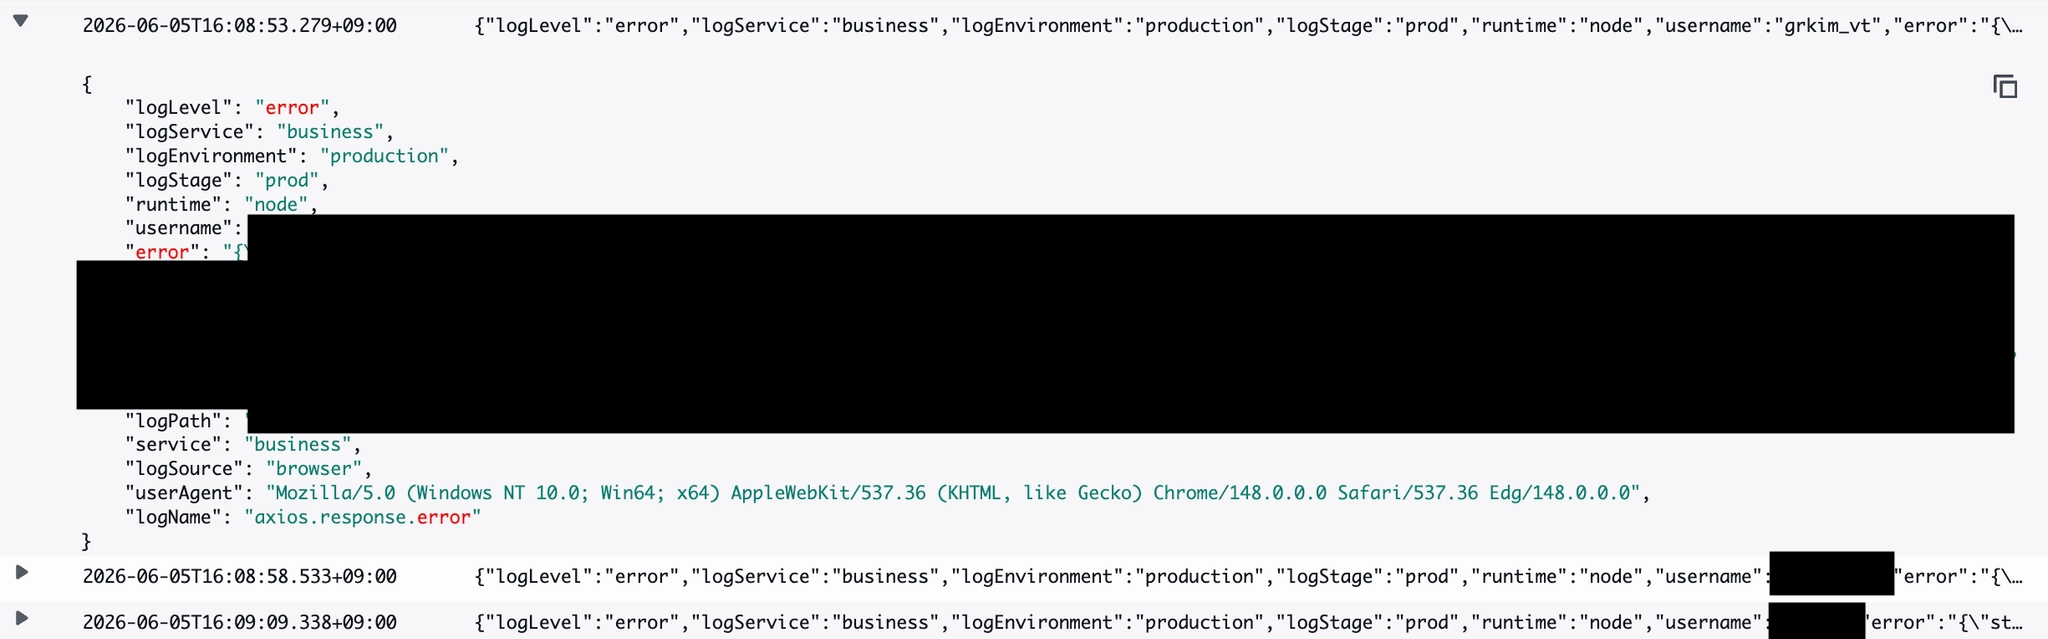 Now we can see that all context of a single log is neatly stacked into one message.
Now all developers in the company can integrate the logger, add logging wherever they want, and "identify and resolve service problems before anyone else."

Not only did I receive positive feedback from team members I shared this with before production deployment, but as I gradually saw myself identifying and solving problems through logging at the service level, I thought it was worth building, even if it's modest.
It's still a logger that only works on the FE side, but I hope it becomes a logger that can also be used on the BE in the future. And with that, I'll wrap up this post.