BLOG
KO
Next.js CloudFront Cost Diet
- 0. Diagnosing the Current Situation
- 1. CloudFront Diet - Next.js Static Assets
- 1.1 Root Cause Analysis - Chunk Analysis, Network Coverage Analysis
- 1.2 Action - Removing Barrel Exports
- 1.4 Results
- 2. CloudFront Diet - ELB
- 2.1 Root Cause Analysis - CF Log File Analysis
- 2.2 Action 1) - Applying Caching to CF Paths
- 2.2 Action 2) - Using External CDN
- 2.2 Action 3) - Applying Cache in next.config.js
- 2.2 Action 4) - Dynamic Font Loading
- 2.3 Results
- 3. Conclusion
Recently, we rolled out the biggest update for Inpocklink, the service we're running at my current company.
The design customization feature update!

From a product perspective, we provided various features and improved user convenience, and technically, we also went through a tech stack migration (Vue -> React), which meant dealing with everything from deployment processes to various issues, hotfixes, and stability work.
A few days later, a message popped up on Slack...

I can't share the exact numbers, but basically, all metrics had increased by at least 2x, and up to 4x. The daily CloudFront (CF) costs had skyrocketed by 2.5x... Realizing this could turn into a real disaster, I immediately jumped into normalizing the CF costs, and in this post, I'll share that journey.
TL;DR
- Let's learn about barrel exports
- Let's learn about AWS CF caching
- Let's learn about Next.js public paths and caching
0. Diagnosing the Current Situation
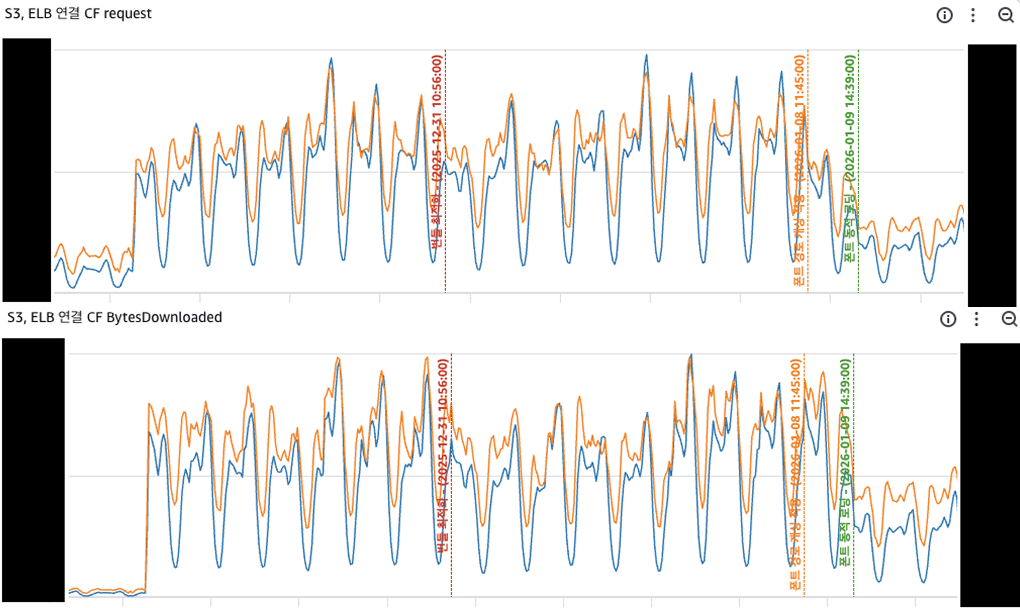
First, to identify exactly which CF was incurring the most costs, I created a CloudWatch dashboard that gave me a bird's-eye view of all production CFs, which included:
- Nuxt static asset CF (pre-migration)
- Next.js static asset CF (post-migration)
- CF connected to ELB and S3 running in production
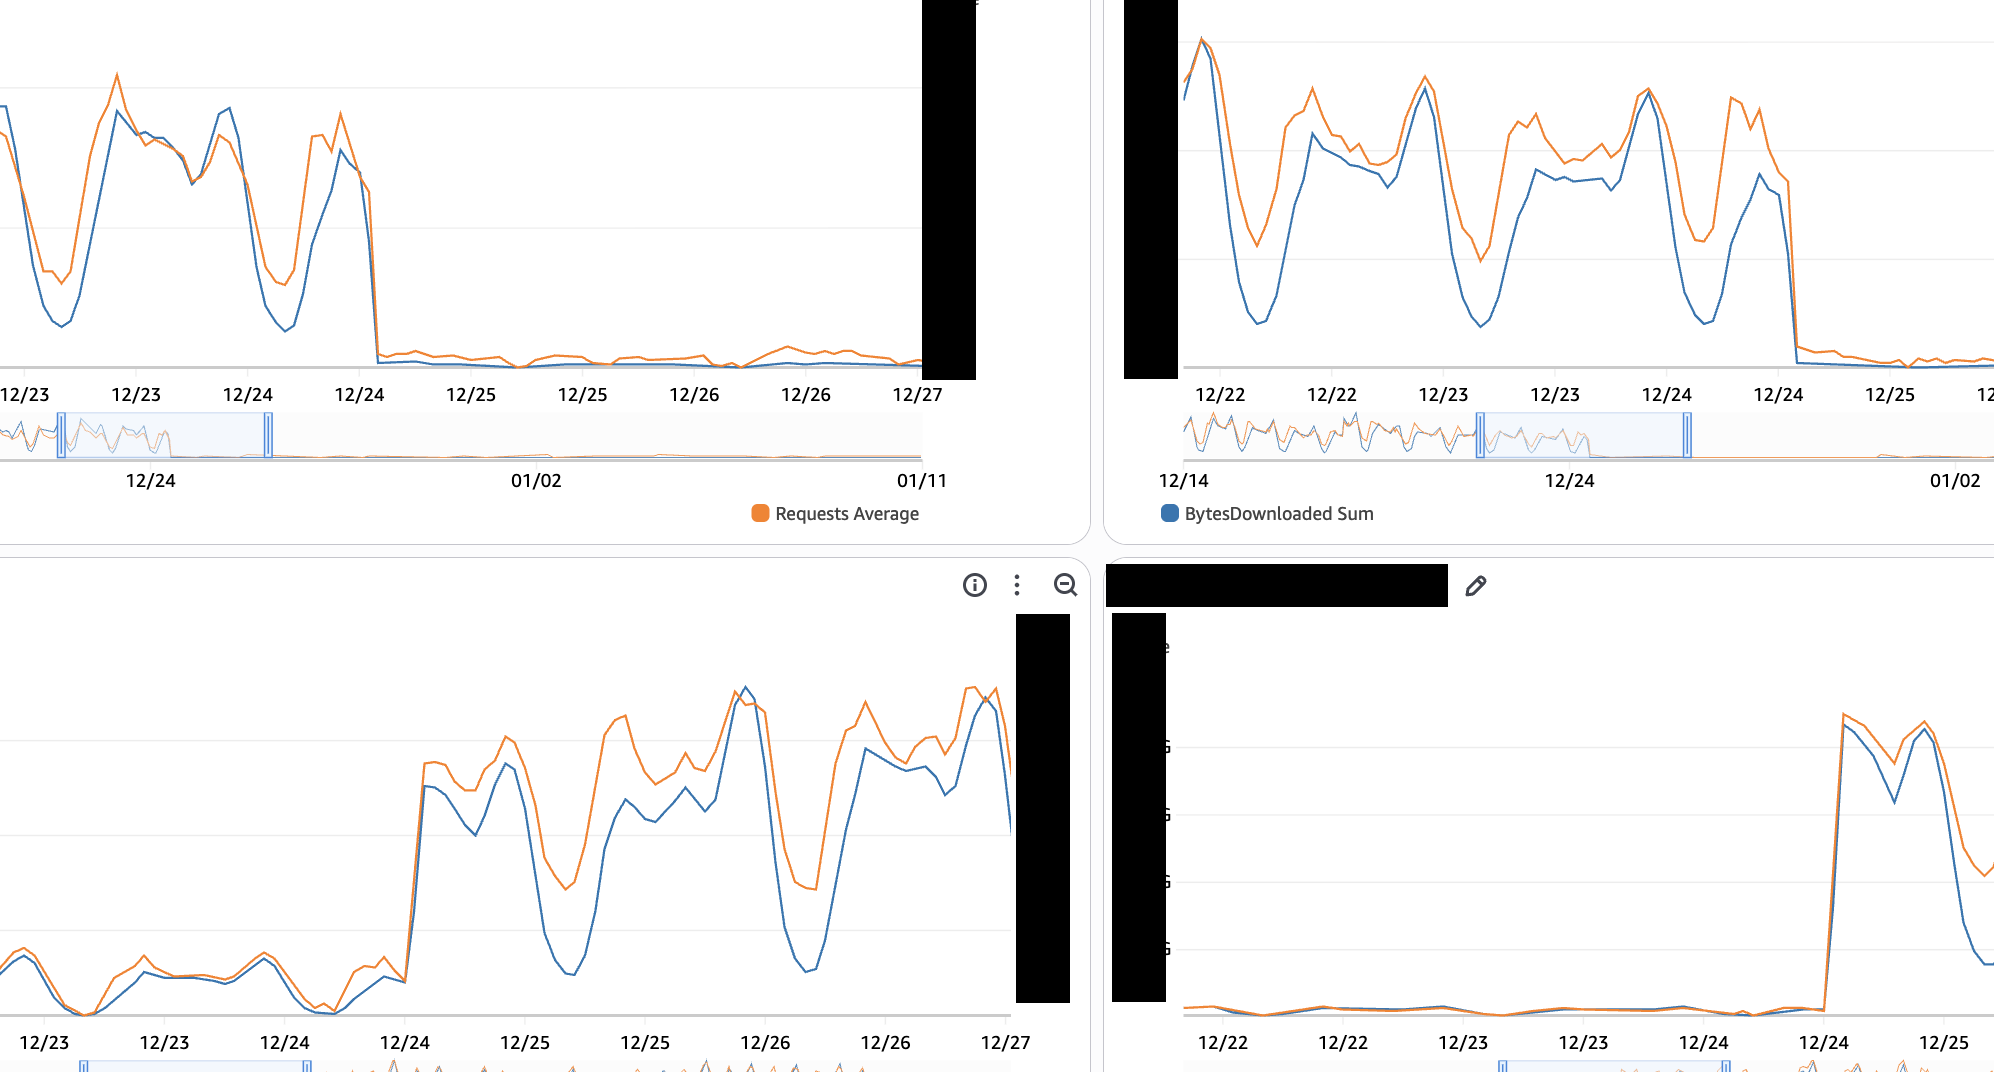
As you can see in the image above, the Nuxt CF costs naturally decreased after migration (top 2 graphs), so I dug into the Next.js CF and the ELB-connected CF one by one.
1. CloudFront Diet - Next.js Static Assets
1.1 Root Cause Analysis - Chunk Analysis, Network Coverage Analysis
To figure out how many Requests and Data Transfer were actually happening in the service, I used @next/bundle-analyzer to analyze chunks. Since our service naturally concentrates traffic on specific pages (each creator's profile page), I focused the analysis on those pages.
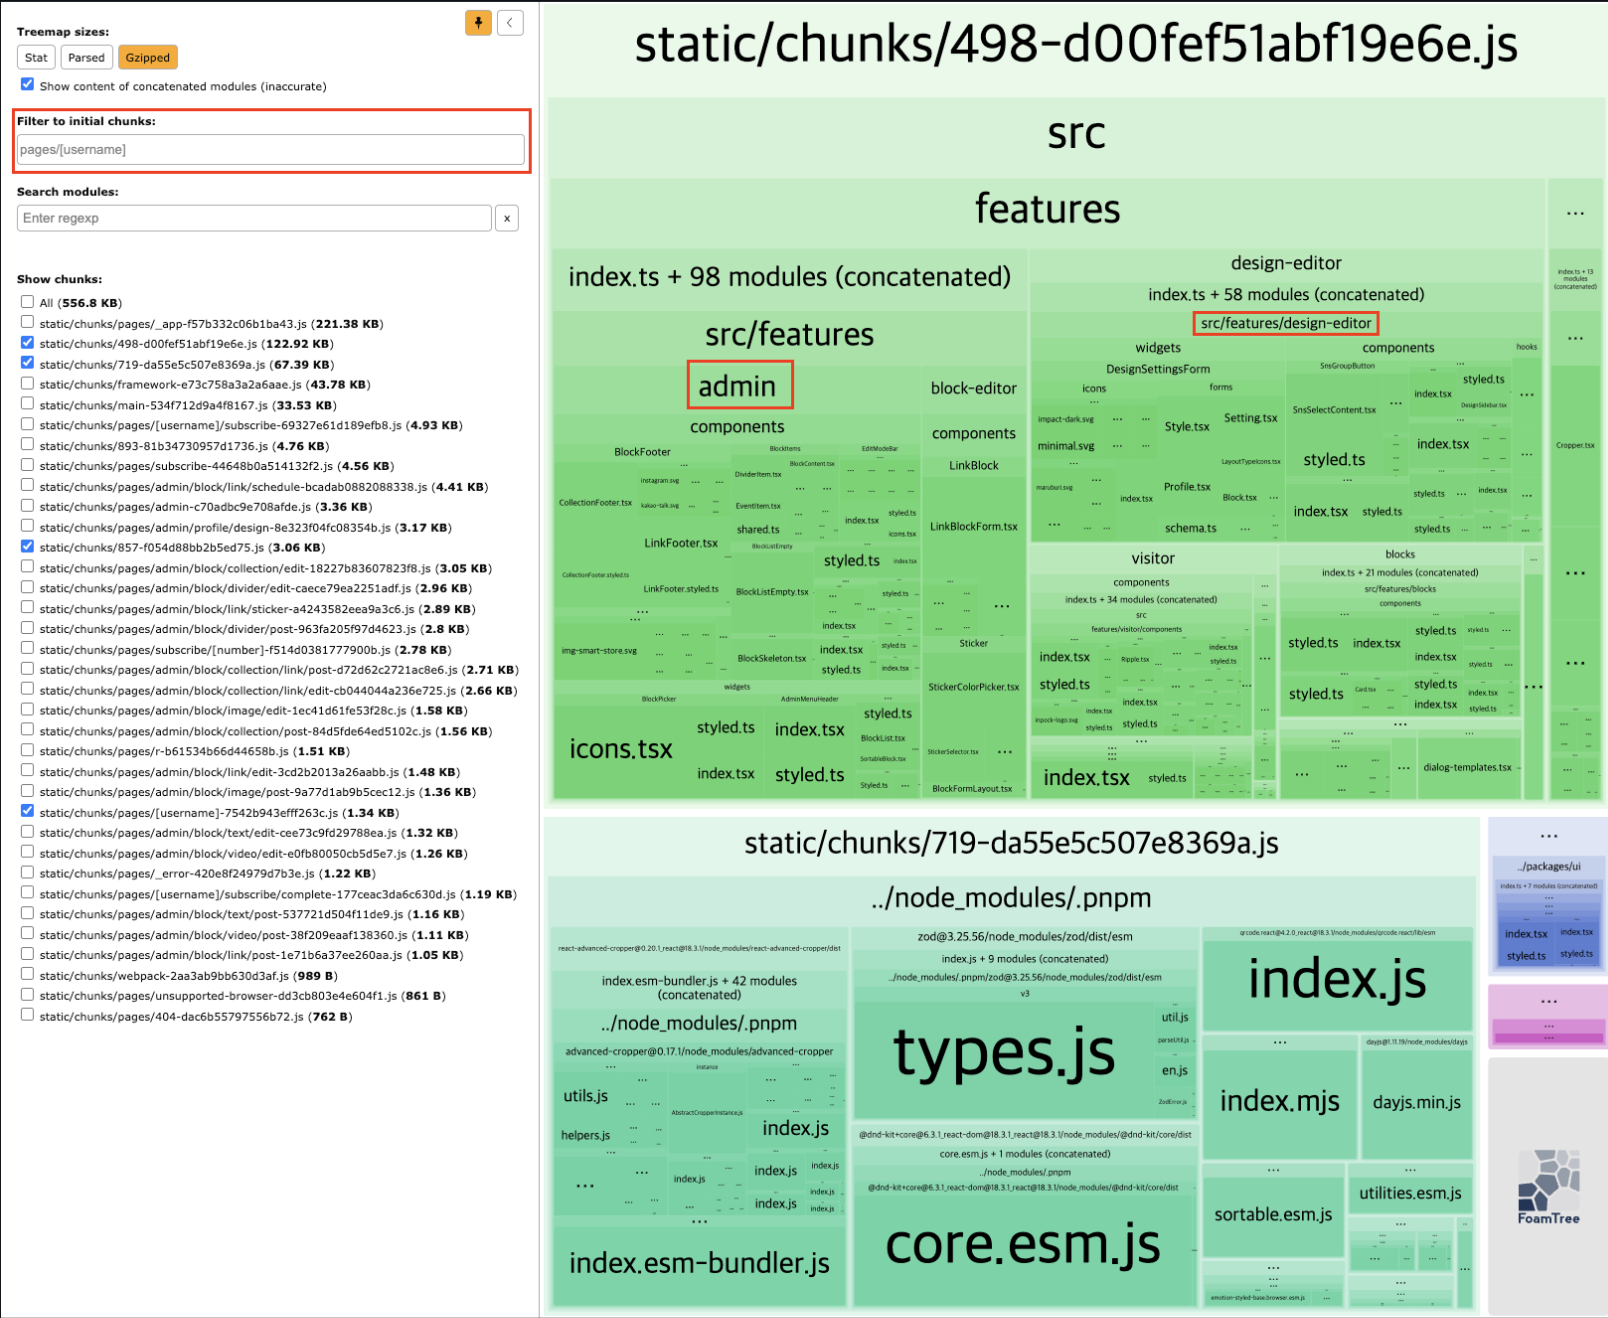
- 194.71kb (gzipped)
- Includes unnecessary chunks like admin and design-editor
Along with chunk analysis, I used Chrome DevTools to check the size of chunk files coming from CF and their coverage.
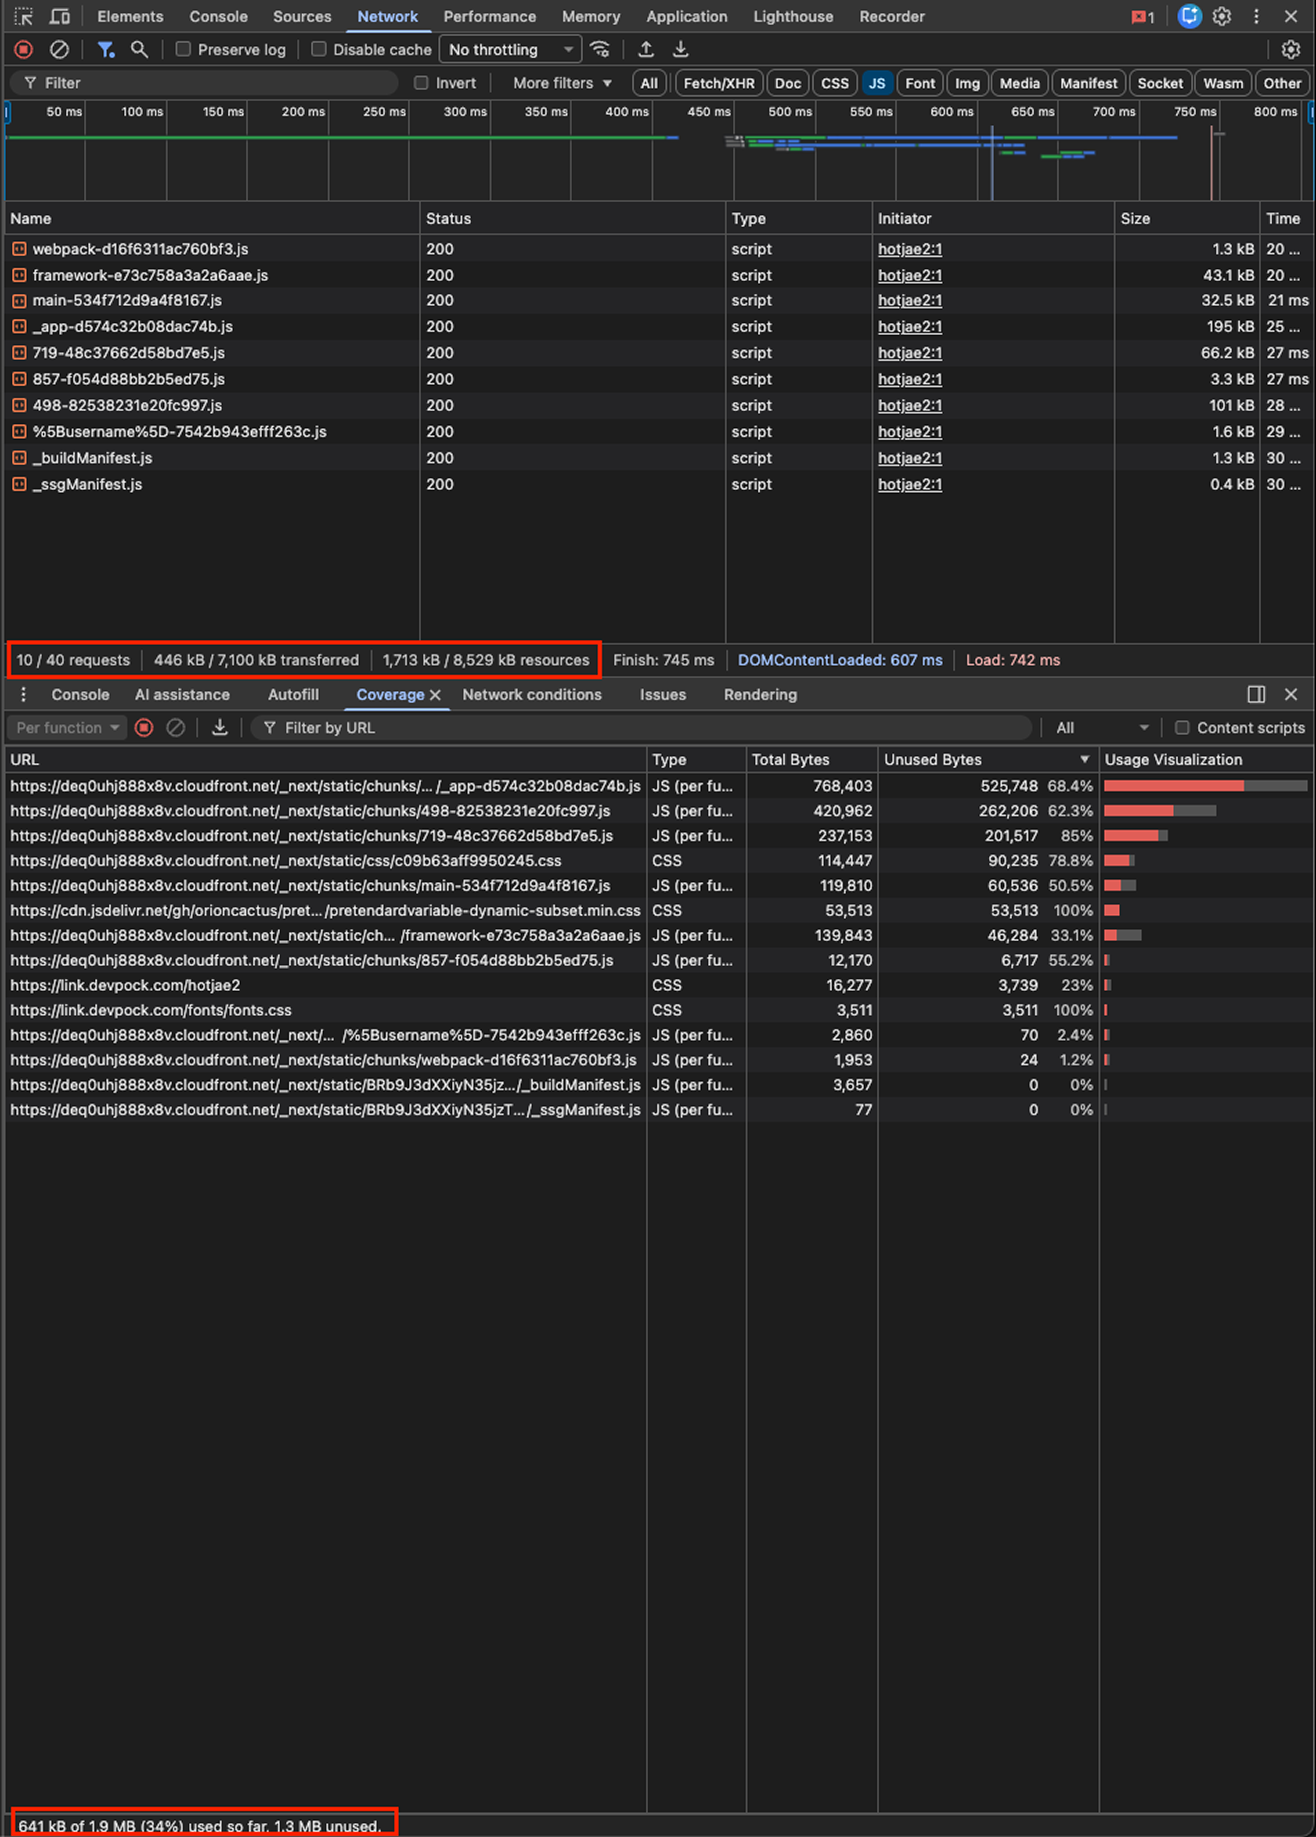
- 34% coverage out of total 1.9MB
Next.js supports code splitting based on routes by default, so why was this happening (requesting unused chunks)?
1.2 Action - Removing Barrel Exports
The culprit was barrel exports. Barrel export is a pattern where you export multiple files from a single entry point.
// components/index.ts
export * from './Image'
export * from './Icon'

// When using at the page level
import { Image, Icon } from '@/components'
ECMAScript Modules (ESM), JavaScript's standard module system, traverses modules using depth-first post-order traversal (reference link). Since it evaluates child nodes first and parent nodes last, when using barrel exports, it ends up evaluating all exports declared in the components/index.ts file.
(In fact, one user reported that switching from barrel exports to direct imports reduced their bundle size from 255kb to 92.4kb.)
Our code was well-organized by feature, but we were using barrel exports for common components and such. I made modifications to remove some of these, checking bundle size changes through bundle analyze locally.
1.4 Results
After removing barrel exports and applying dynamic imports to some components, the results were:
- Chunk analysis
- Size:
194.71kb -> 96.41kb(51% reduction) - Removed unnecessary chunks like admin and design-editor
- Size:
- Chrome DevTools analysis
- Size:
1.9MB -> 1.3MB(31% reduction) - Coverage:
34% -> 38%(11% increase)
- Size:
2. CloudFront Diet - ELB
2.1 Root Cause Analysis - CF Log File Analysis
To identify exactly which requests were causing the ELB CF cost increase, I used GPT to analyze CF log files from certain time periods, and the results were:
| Path | Requests | BytesDownloaded |
|---|---|---|
| /fonts/pretendard/Pretendard-Regular.woff2 | 38,775 | ~21.4 GB |
| /fonts/pretendard/Pretendard-Bold.woff2 | 33,860 | ~19.7 GB |
| /fonts/pretendard/Pretendard-SemiBold.woff2 | 33,549 | ~19.4 GB |
| /fonts/pretendard/Pretendard-Medium.woff2 | 33,905 | ~19.3 GB |
| /fonts/maruburi/MaruBuri-Regular.woff2 | 38,736 | ~12.1 GB |
| ... | ... | ... |
I suspected font files might be the cause, but the log analysis made it crystal clear. For the font customization feature mentioned earlier, we had added font files to Next.js's public directory and were loading fonts through a fonts.css file, but this part wasn't optimized, so every page was requesting every font.
2.2 Action 1) - Applying Caching to CF Paths
First, I applied path-based caching in CF. CF allows you to specify origin (S3, ELB, etc.), origin policy, and cache policy for each path, so I used this to apply a 1-year cache policy to the /fonts/* path.
I thought this would solve the problem, but CF's Requests and BytesDownloaded didn't improve at all—and this was actually a part we misunderstood. Even with CF caching applied, it only reduces Origin -> CF requests (= only reduces origin load), not CF -> User requests, so costs didn't improve at all.
2.2 Action 2) - Using External CDN
The next solution I considered was using an external CDN. Using an external CDN like Noonnu could completely eliminate cost burden, which was attractive, but after discussing with my fellow developer, we decided not to implement this due to various issues like "lack of control" and "burden on core business logic."
2.2 Action 3) - Applying Cache in next.config.js
Ultimately, we needed to somehow reduce font file requests at either the code or infrastructure level. While wrestling with GPT, I discovered something strange.
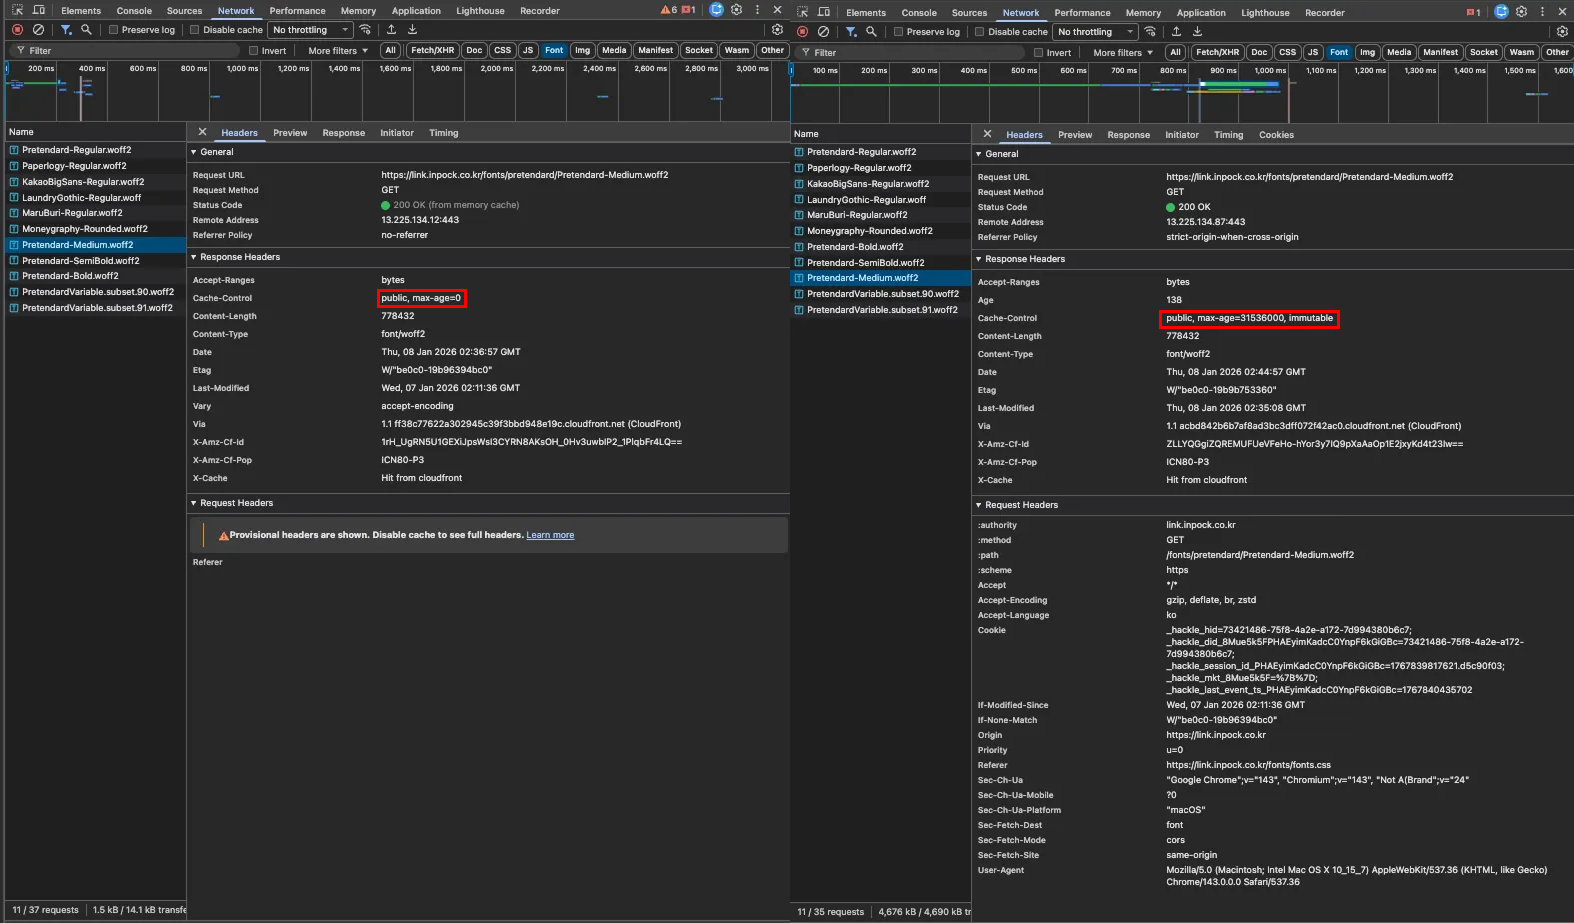
The Network tab showed that font files were cached, but when I actually looked at the headers, they showed max-age=0, meaning no caching was applied at all.
This seemed suspicious, so after some research, I discovered something I didn't know: Next.js Official Documentation: public Folder - Caching
Next.js cannot safely cache assets in the public folder because they may change. The default caching headers applied are:
Cache-Control: public, max-age=0
Next.js doesn't apply caching to files in the public directory by default, so browsers were revalidating them every time.
To fix this, I explicitly applied caching to font files in next.config.js.
// next.config.js
async headers() {
  return [
    {
      source: '/fonts/:path*',
      headers: [
        {
          key: 'Cache-Control',
          value: 'public, max-age=31536000, immutable',
        },
      ],
    },
  ];
},
2.2 Action 4) - Dynamic Font Loading
Caching was now applied, but the fundamental problem remained: every page was still requesting every font.
To solve this, I split the existing fonts.css file and modified the code to load only the necessary fonts.
AS_IS
@font-face {
  font-family: 'Pretendard';
  src: url('/fonts/pretendard/Pretendard-Regular.woff2') format('woff2');
}
... and many other fonts
TO_BE
@import url('./pretendard.css');// FontLoader.tsx: Load only necessary fonts dynamically
export function FontLoader({ fontKey }: FontLoaderProps) {
const config = getFontConfig(fontKey);
return (
<Head>
<link rel="stylesheet" href={config.cssUrl} />
</Head>
);
}2.3 Results
Through these optimization efforts, we completely resolved the cost spike issue caused by the update, and achieved a small reduction (10-20%) in client CF costs compared to before.
More importantly, we built a dashboard to monitor all client-side CFs, which I now check first thing every morning.
3. Conclusion
Of course, there are still many problems to solve:
- Lightening bundles through design system optimization
- Reducing CF requests (both Requests and BytesDownloaded affect costs, but Requests have a bigger impact)
Still, going through the entire process of identifying the cause → applying various solutions → seeing results really allowed me to exercise my favorite principle: "Be uncomfortable first, and stay uncomfortable until the end." It was a personally rewarding experience.